Data Scientist LinkedIn banner
Templates for data scientists, with your words already in place. Edit anything, check where your photo sits, and download a 1584×396 PNG.
Independent tool, not affiliated with LinkedIn
Templates
Layers
Select a layer to edit it
Background

Your Name
Your headline appears here
What to write on a data scientist banner
Three lines that work, ready to copy into the editor.
- Experiments you can trustData Scientist · Causal inference and A/B testing
- Forecasts that planners useDemand forecasting · Python, R, Spark
- Compared to what?Data Scientist · Writing about experiment design
Banner advice for data scientists
Data scientists often reach for a chart as their banner, and that can work if the chart says something. A random scatter plot or a stock image of glowing numbers says nothing. Better options are a single clean line showing a forecast against actuals, a simple before-and-after from an experiment, or no chart at all and one sentence about the decisions you help make. Keep axis labels off; at banner size they become unreadable, and a chart with numbers invites questions you cannot answer about real company data. Place the chart on the right two-thirds of the image, with your text above or beside it, so the profile photo does not sit on top of the interesting part.
- Leading with a list of algorithms such as XGBoost, random forests and LSTMs, when hiring managers care more about which business decisions your models changed.
- Using “data scientist” and “data analyst” interchangeably across the profile, which confuses recruiters who search for one and screen out the other.
- Quoting only offline accuracy scores instead of a result measured after the model was in use.
Photos in these templates
Public domain or CC0, checked by hand for faces, logos and readable text.
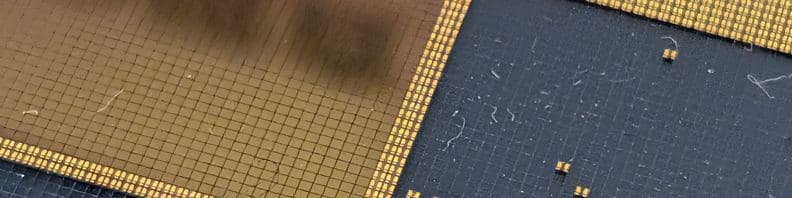
macro photo of a silicon wafer die grid, abstract gold/dark squares pattern · Syced, CC0 1.0 
macro shot of a CPU's pin-grid-array held with tweezers, abstract gradient background · Brian Kostiuk, CC0 1.0


Questions
Can I use a chart from my real work on my banner?
Only if it is already public, such as a figure from a published paper or a company blog post you wrote. Internal charts can reveal revenue, user counts or test results that your employer considers confidential, even with labels removed. A safer route is to recreate the shape with made-up data: a forecast line that tracks actuals, or two distributions that separate after a treatment.
What colors work for a chart-based data science banner?
Use one dark or light background and at most two data colors, with one clearly more prominent than the other, like a bright line for the forecast and a muted line for the actuals. Charts with many colors turn into noise at banner size. Check the colors in grayscale too; if the two lines merge, readers with color vision differences will not see the point.
Should a research-focused data scientist put a paper title on the banner?
A paper title is usually too long and too technical for a banner. Instead, name the research area in plain words, like “causal methods for marketplaces,” and put the paper in your Featured section with a link. If the paper is well known in your field, a short reference such as the venue and year in the sub-line can work.